
The Ottawa real estate market has historically been a stable market for many reasons including our local economy, housing supply and strong pricing compared to other major Canadian cities. There’s no doubt that if you’re looking for somewhere to build your life, and your real estate portfolio, Ottawa is a great place to start. The only question left is: which Ottawa neighbourhood is the best place to invest in real estate?
In this blog, we’ll take a look at Ottawa house prices by neighbourhood to give you an overview of trends we’re seeing and potentially help you decide which neighbourhood is right for you.
Have specific questions about an Ottawa neighbourhood not listed? Reach out to our team or explore other Ottawa neighbourhoods.
House Prices By Neighbourhood: Manotick Village, ON

Manotick is a great community for many reasons, not just real estate investment! Our team’s office is located in Manotick and many of our team members live in this charming neighbourhood. There’s a lot to love about Manotick but let’s get down to the numbers!
Manotick Real Estate Trends 2025
Manotick’s charm has been attracting more homebuyers in recent years, particularly after the pandemic, because of its small-town feel, large homes and lots, and its proximity to Downtown Ottawa. The demand for homes in this area has increased and with that comes increased house prices. Within Manotick there are pockets where homes are available below $1M still while other areas have properties worth upwards of $2M (see chart below).
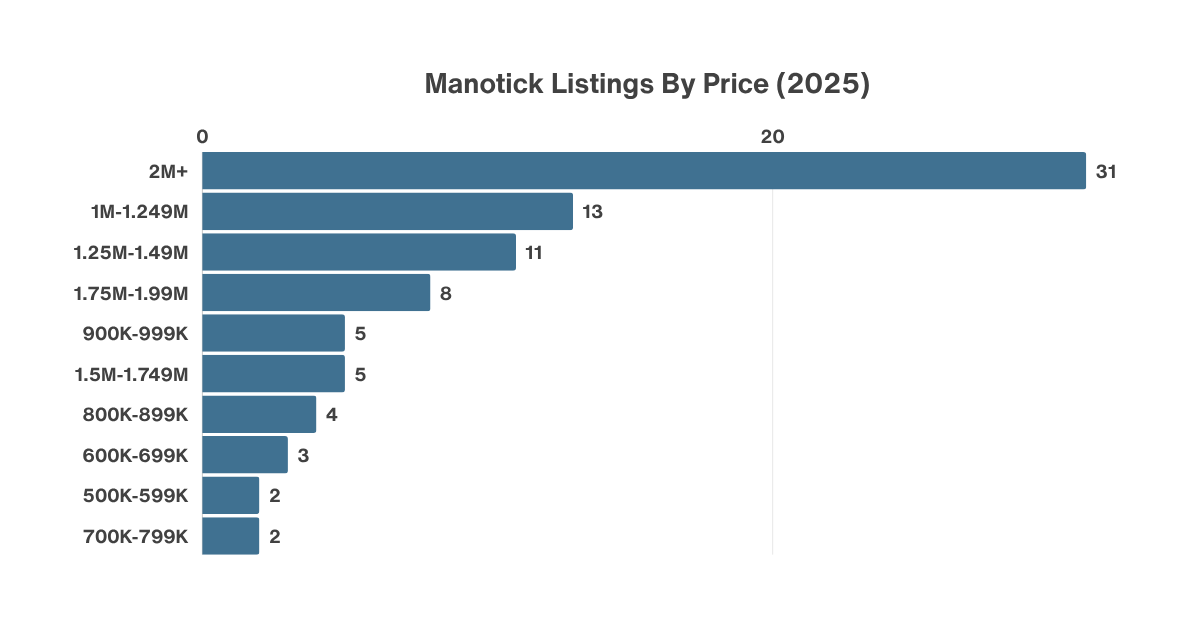
Manotick Real Estate Prices (January 2025 – Oct 2025)
The average sale price in Manotick right now sits at $1,097,826 with 14.5% selling above listing price.
Average Days on Market for Manotick in 2025 is 41 days.
Average listing price in Manotick is $1,453,492.
Manotick saw drastic spikes in prices in 2020 and 2021 due to the lifestyle changes that came from the pandemic and work from home mandates. Buyers were looking for more space for their families and Manotick reaped the benefits of this trend. In 2020 and 2021, home prices increased by 27.5% and 24.2% compared to the previous year, however as the market and economy shifted we saw price decreases from 2022 to 2024 with prices beginning to rebound in 2025 (see chart below).
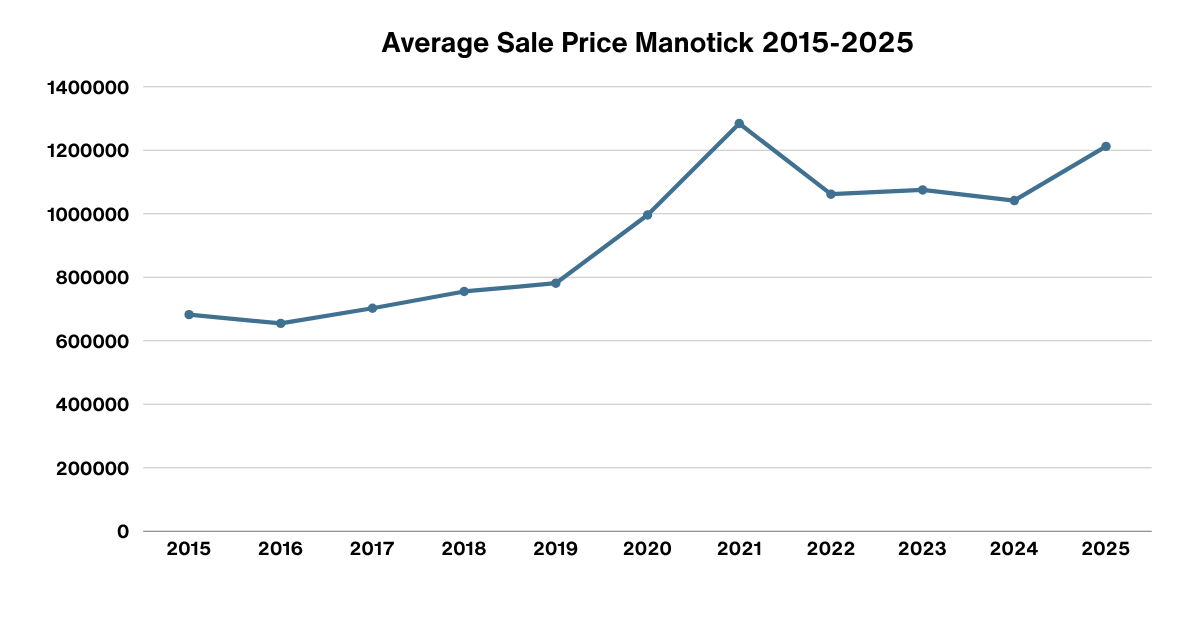
While growth dipped back down in 2022 and 2023, we’re seeing more activity in this neighbourhood once again, and with increased transactions, we’ll likely see prices increase in Manotick before year end.
Overall, we’re predicting Manotick home prices to rise by the end of this year and continue on an upward trajectory into 2025.
House Prices By Neighbourhood: Westboro, ON
Westboro is one of Ottawa’s most sought after neighbourhoods since it blends a vibrant city feel with a true sense of community. Historically, Westboro has been a great neighbourhood for young professionals, young families and downsizers. But how do the numbers compare to other popular Ottawa neighbourhoods?
Westboro Real Estate Trends 2025
Westboro has seen good growth over the past decade but this neighbourhood is limited in space. Unable to expand, Westboro has a mix of older homes and new-build infill properties and townhouses. This neighbourhood has also attracted multi-unit development, as it caters to young people and downsizers. With a broad range of housing types prices can range, with a majority of inventory sitting within the $500,000 – $1,000,000 range (see chart below).
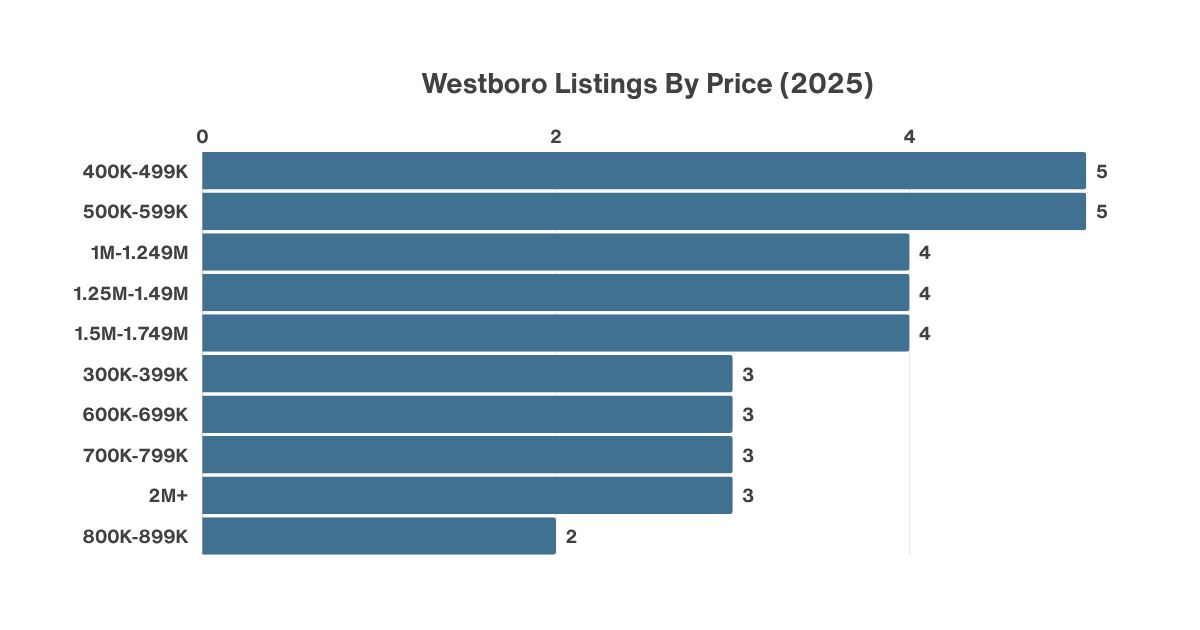
Westboro Real Estate Prices (January 2025 – Oct 2025)
The average sale price in Westboro right now sits at $930,315 with 23.1% selling above listing price.
Average Days on Market for Westboro in 2025 is 21 days.
Average listing price in Westboro is $1,130,268.
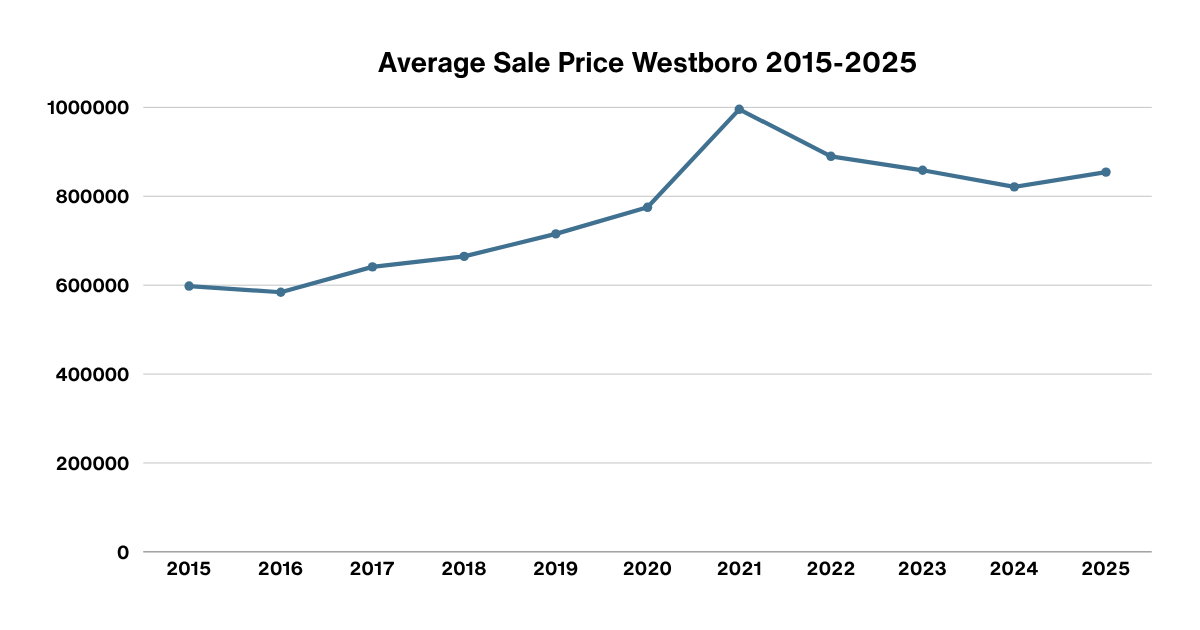
If you’re a first-time buyer, Westboro could be a great place to start your house search! We predict we’ll see price growth in this neighbourhood through the rest of 2025 and into 2026,
House Prices By Neighbourhood: Stittsville, ON
Stittsville is a great place for families looking for a little more space and that feel of rural living. It’s a great community that offers opportunities for new-build construction, larger plots of land and even some condo and townhouse options.
Stittsville Real Estate Trends 2025
Stittsville has remained an attractive neighbourhood to buyers even through the post-pandemic real estate lull. This neighbourhood was one of the few that saw overall price growth in 2022 when the market was stagnant. In 2025, a majority of inventory is listed within the $700,000 to $1,000,000 range (see chart below).
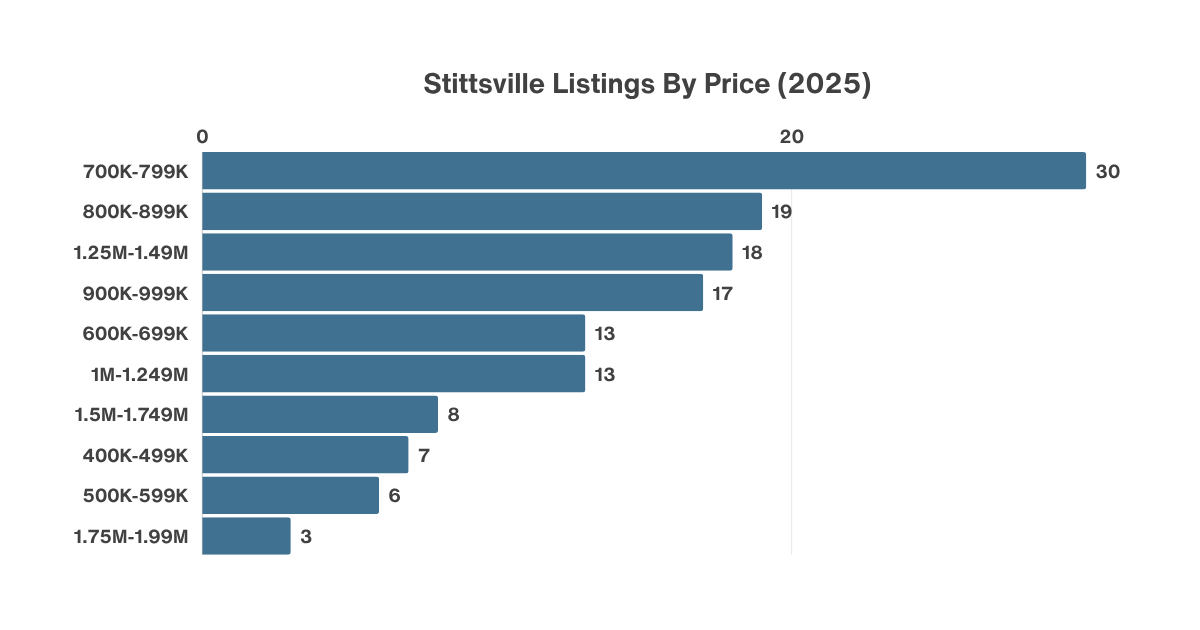
Stittsville Real Estate Prices (January 2025 – Oct 2025)
The average sale price in Stittsville right now sits at $790,918 with 15.6% selling above listing price.
Average Days on Market for Stittsville in 2025 is 21 days.
Average listing price in Stittsville is $880,319.
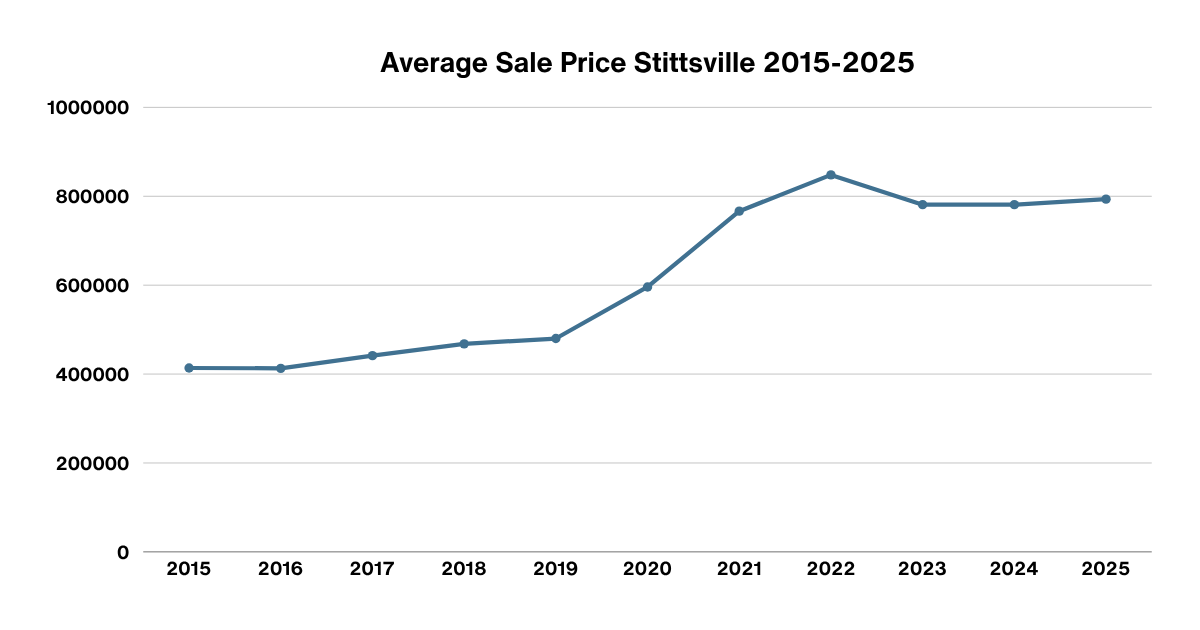
Even with the slight dip in price in 2023 & 2024, we expect prices to be on the rise through 2025 and into 2026. This neighbourhood has a lot of potential and the space to expand. If you’re looking for a new-build opportunity in Ottawa, Stittsville might be the right fit for you!
House Prices By Neighbourhood: Barrhaven, ON

Barrhaven is one of the most sought after suburbs of Ottawa for many reasons, mainly its affordability in comparison to other communities. With easy access to Downtown Ottawa, Barrhaven is a very attractive neighbourhood for young professionals and growing families.
Barrhaven Real Estate Trends 2025
Being that Barrhaven is one of the “newer” suburbs of Ottawa, it’s been able to sustain growth over the last few years. It offers many amenities that young families are looking for like outdoor space, parks, and good schools. This neighbourhood also has very diverse housing options with single-family, townhomes and condos available, it’s a great spot for first-time buyers to look for a home within a broad price range (see chart below).
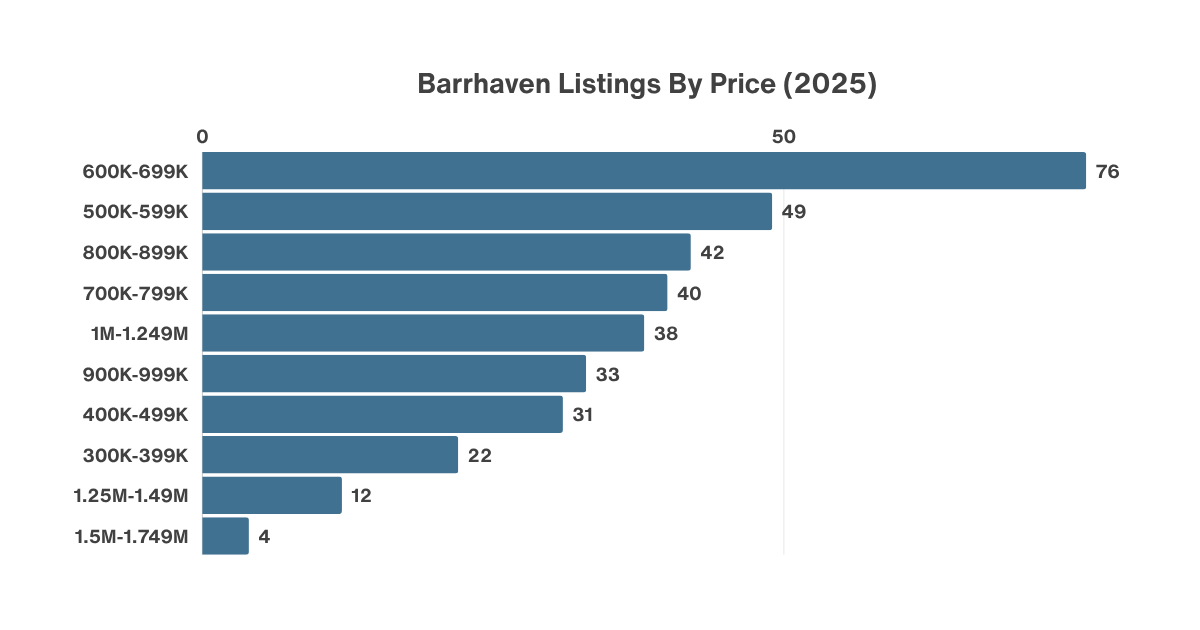
Barrhaven Real Estate Prices (January 2025 – Oct 2025)
The average sale price in Barrhaven right now sits at $670,476 with 14.6% selling above listing price.
Average Days on Market for Barrhaven in 2025 is 21 days.
Average listing price in Barrhaven is $738,492.
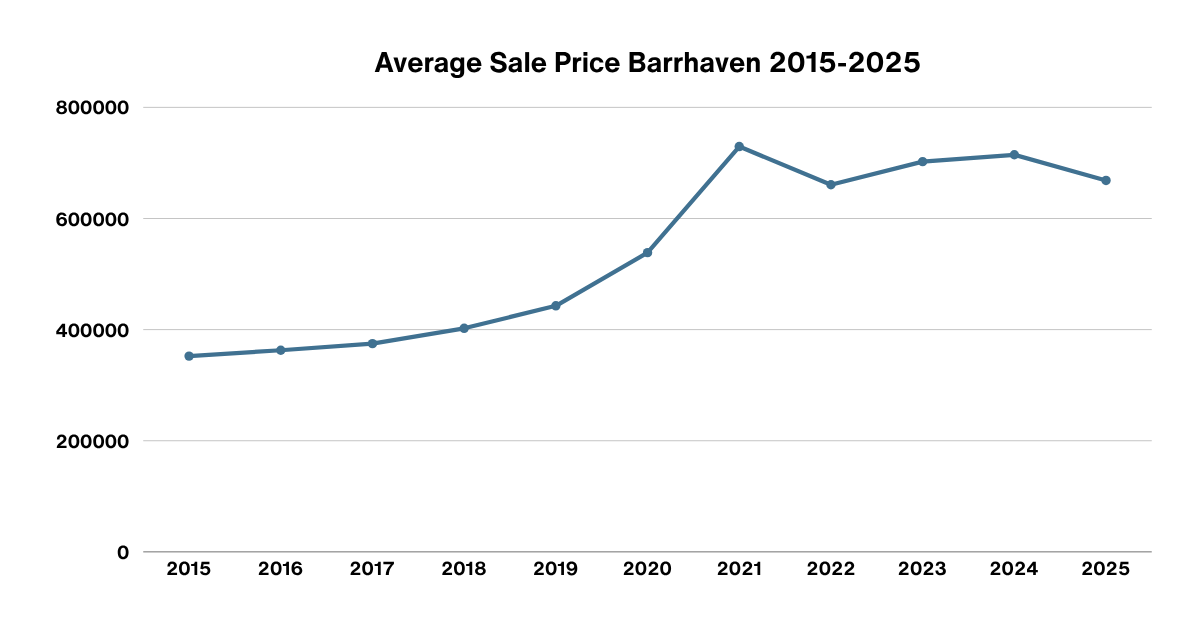
While we are see a slightly lower average sale price in the first half of 2025 we do expect pricing to adjust through the end of 2025, increasing over 2026.
House Prices By Neighbourhood: Riverside South, ON.

Riverside South is a rapidly growing suburb in Ottawa known for its scenic surroundings and family-friendly vibe. With its proximity to the Rideau River, access to nature trails, and convenient commute to downtown, it’s a top choice for families and professionals alike. New developments and expanding amenities make it an increasingly popular place to call home.
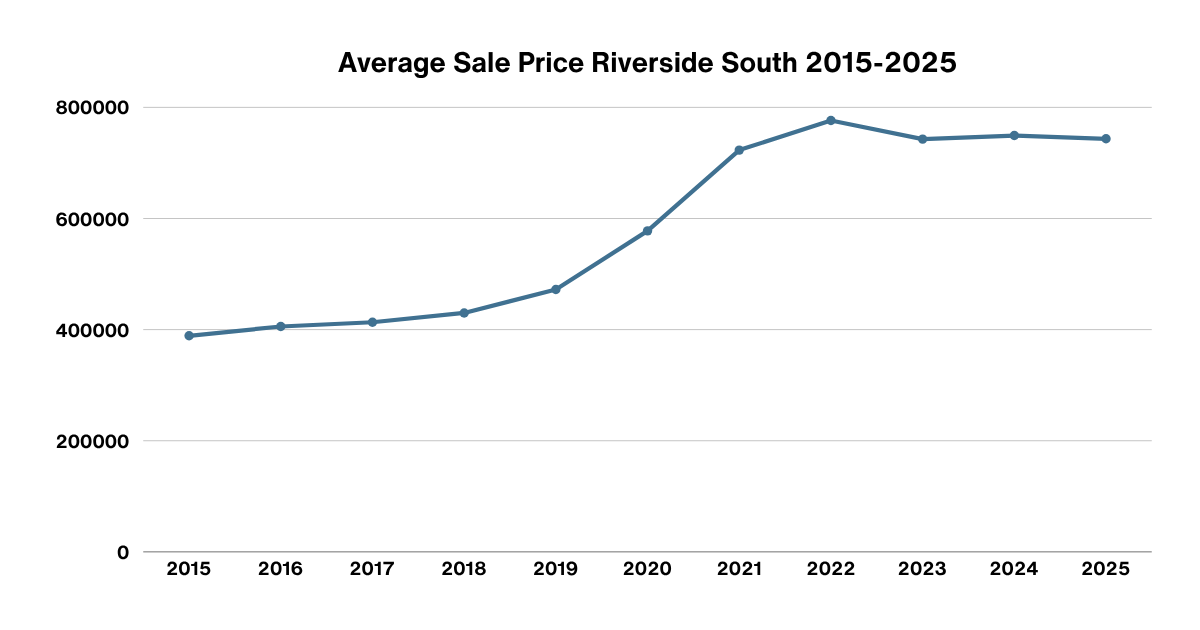
Riverside South Real Estate Trends (2025)
Riverside South has seen steady growth in recent years thanks to its blend of natural beauty and modern development. As one of Ottawa’s newer suburban communities, it offers plenty of green space, parks, and access to quality schools—making it especially appealing to young families. With a mix of single-family homes, townhouses, and some newer condo options, Riverside South provides a wide range of price points for buyers at different stages, including first-time homebuyers (see chart below).
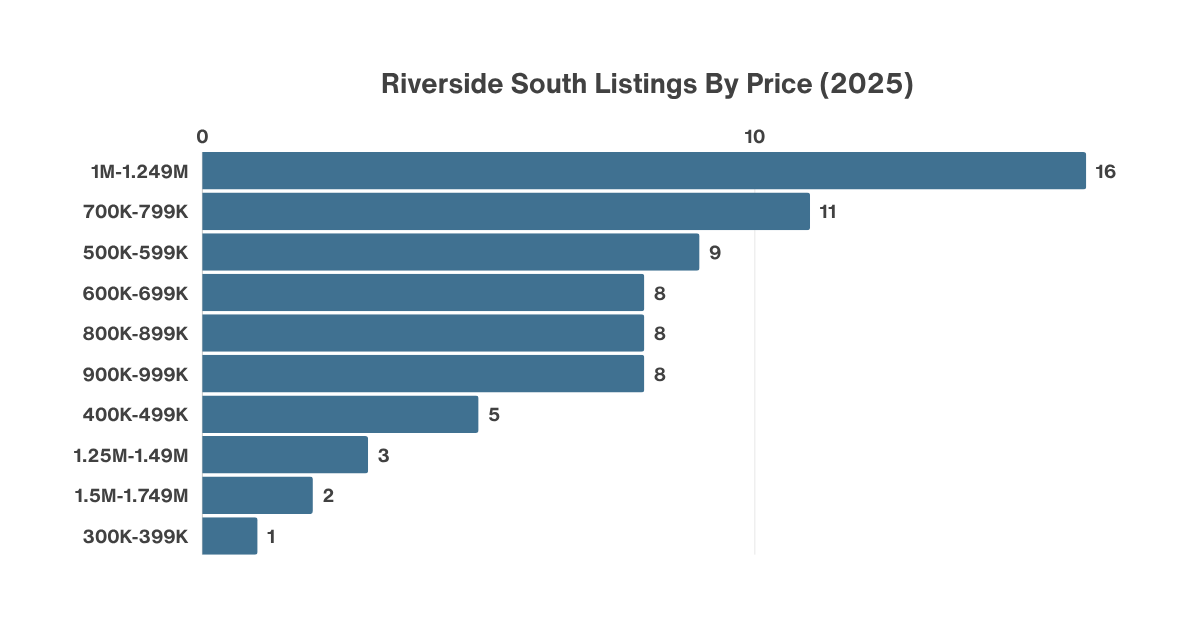
Riverside South Real Estate Prices (January 2025 – Oct 2025)
The average sale price in Riverside South right now sits at $754,416 1with 16.5% selling above listing price.
Average Days on Market for Riverside South in 2025 is 19 days.
Average listing price in Riverside South is $835,341.
While we are see a slightly lower average sale price in the first half of 2025 we do expect pricing to adjust through the end of 2025, increasing over 2026.
Helpful Resources For Ottawa Neighbourhood Trends
If you want to do more research on potential neighbourhoods or want even more up to date price estimates, check out these resources:
- HouseSigma – here you can browse sales data and history to see what neighbourhood trends are happening in real time (you can download their app or access it online)
- Canadian Real Estate Association – CREA releases national and local statistics for Canadian real estate markets, this will give you a good overview of the Canadian real estate market
- Royal LePage – here you’ll find news releases including the Royal LePage Quarterly Market Survey Forecasts and helpful blog articles
When to Start Working With An Ottawa Realtor
Overall, Ottawa is a stable market and investing in real estate here is typically a sound investment. However, knowing the numbers by neighbourhood and the unique trends that they follow can help you make an informed decision about where to invest your money.
Choosing the right neighbourhood ultimately depends on your priorities—whether it’s lifestyle, budget, or potential for appreciation. As interest rates stabilize and demand continues, these neighbourhoods are set to maintain their appeal and growth.
If you’re interested in diving deeper into the intricacies of Ottawa neighbourhoods, connect with our team! We’re here to help you on your real estate journey, no matter what neighbourhood!